Filtering in the Explore view
Add filters from the Filters tab, the field sidebar, or the results table, and nest them into groups
Filters restrict the data a query returns. Filtering a chart in the Explore view changes that chart alone — to filter every tile on a dashboard at once, see dashboard filters. For the filter types and operators available on each field type, see the filters reference.
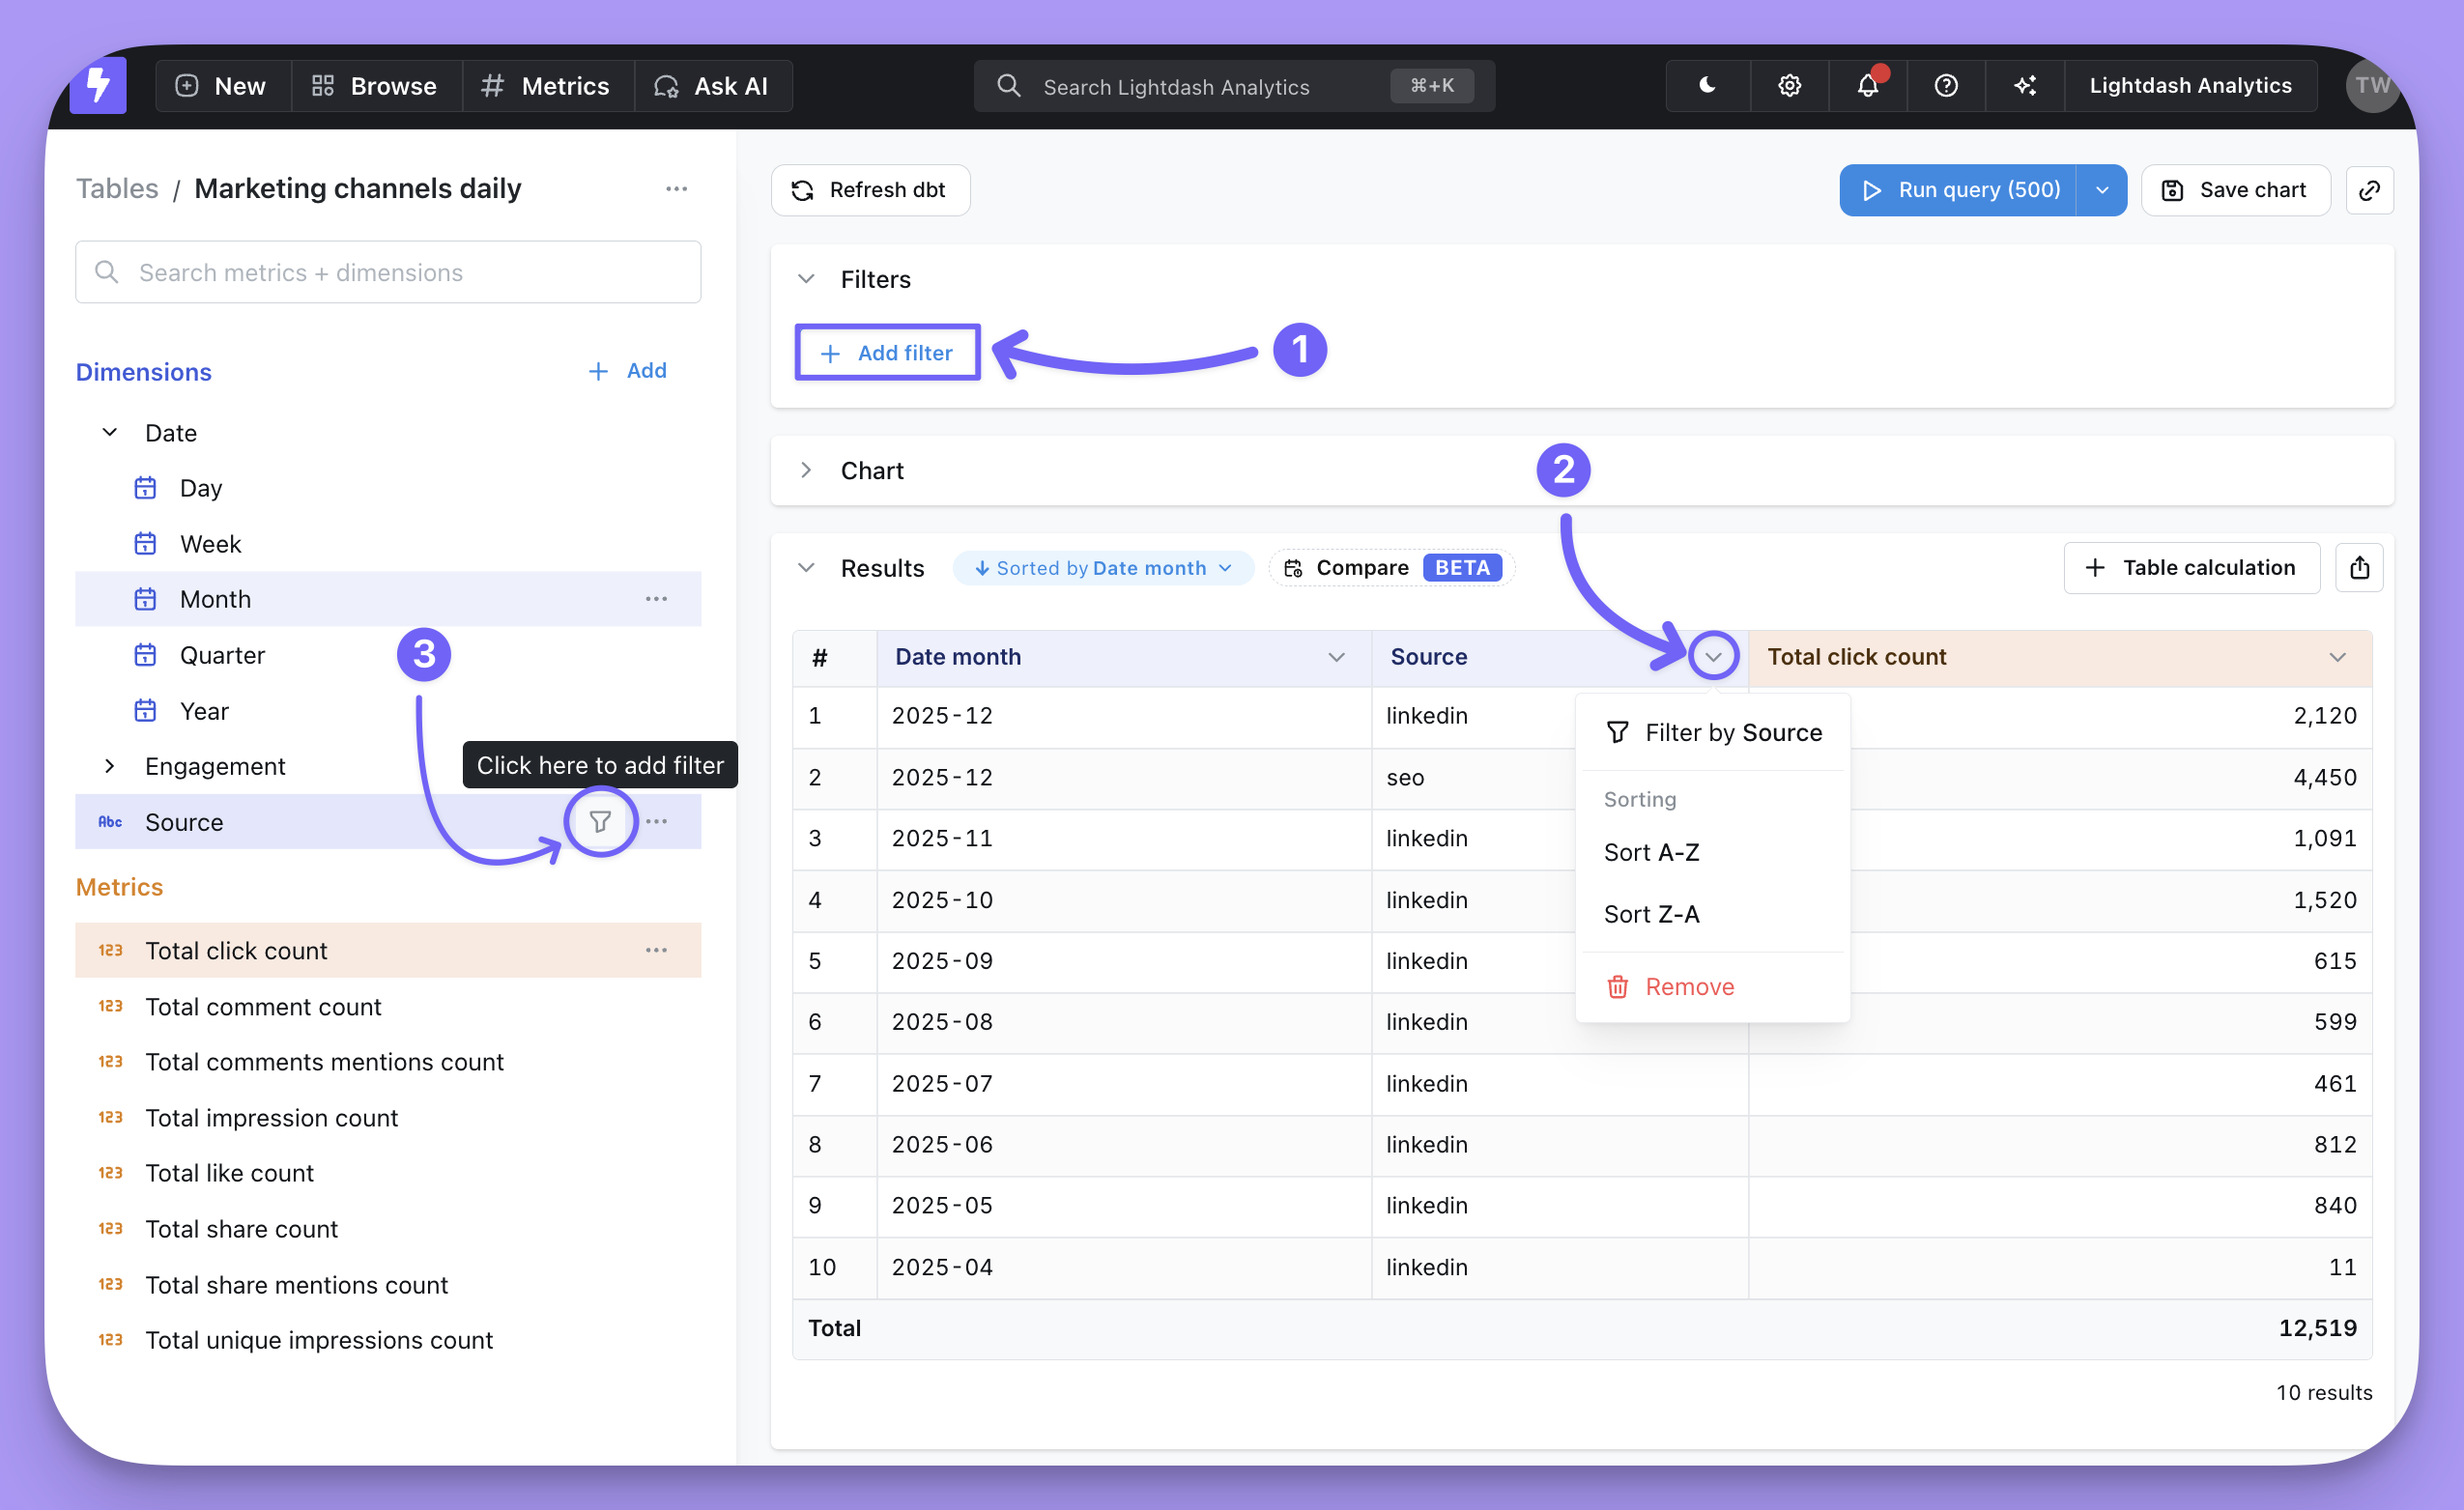
There are three places to add a filter, and they all produce the same thing.
From the Filters tab
Open the Filters toggle, then click Add filter.
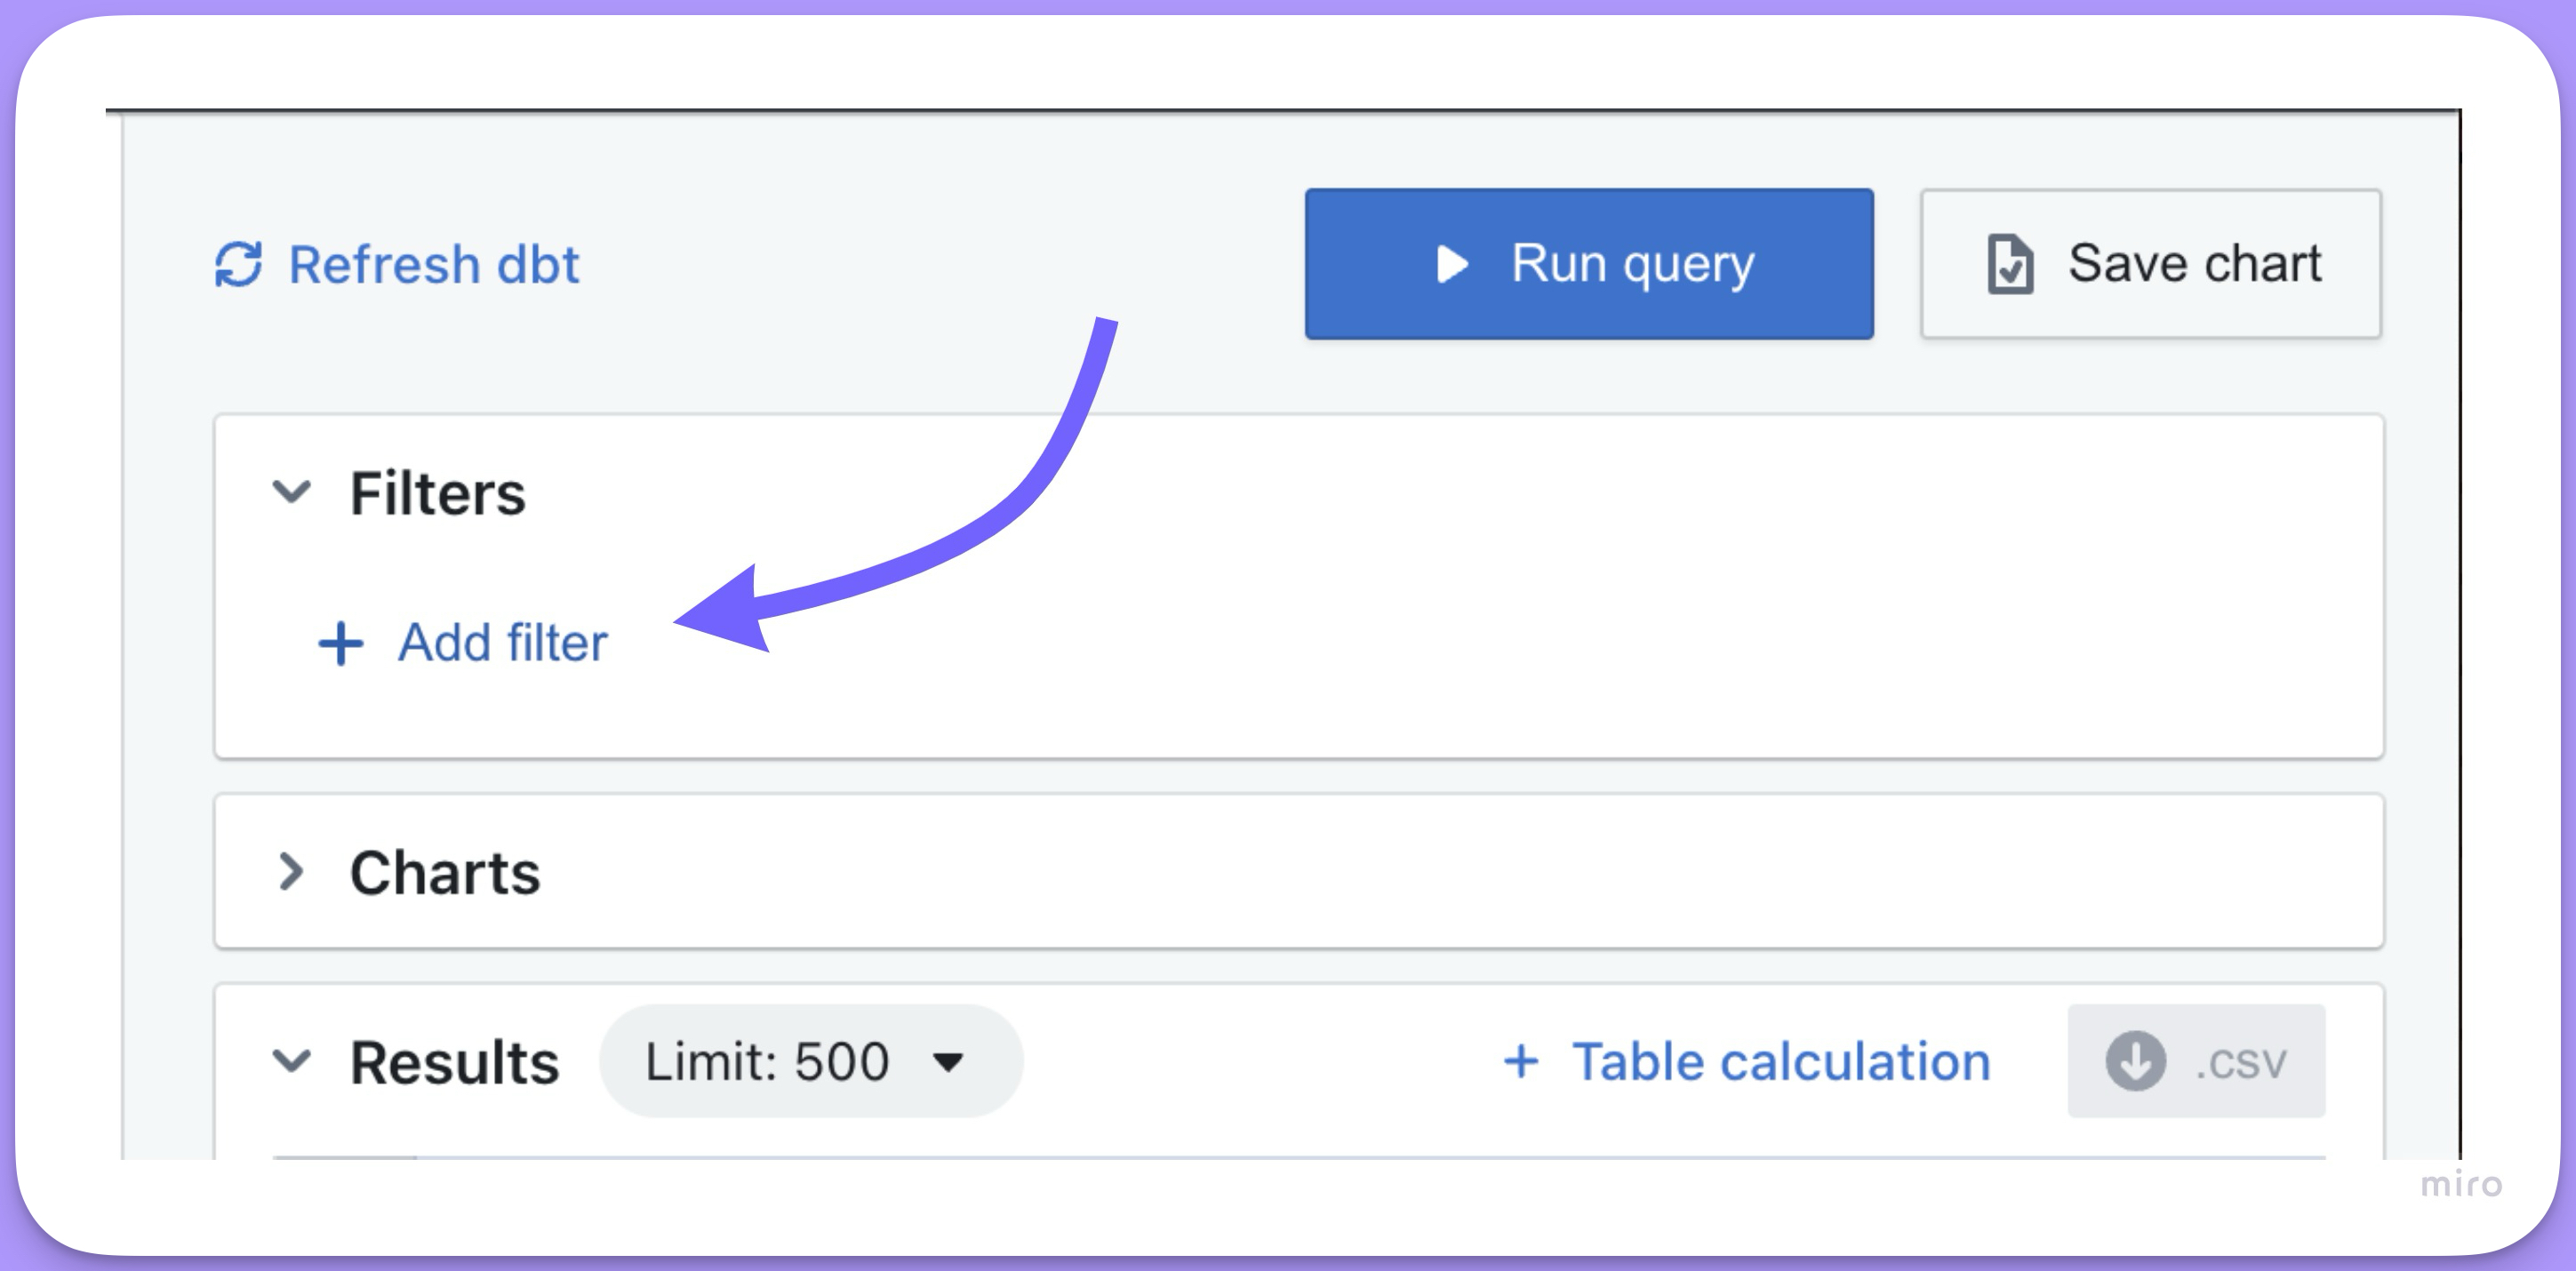
Select the field to filter from the drop-down list, then choose the filtering options.
From the sidebar
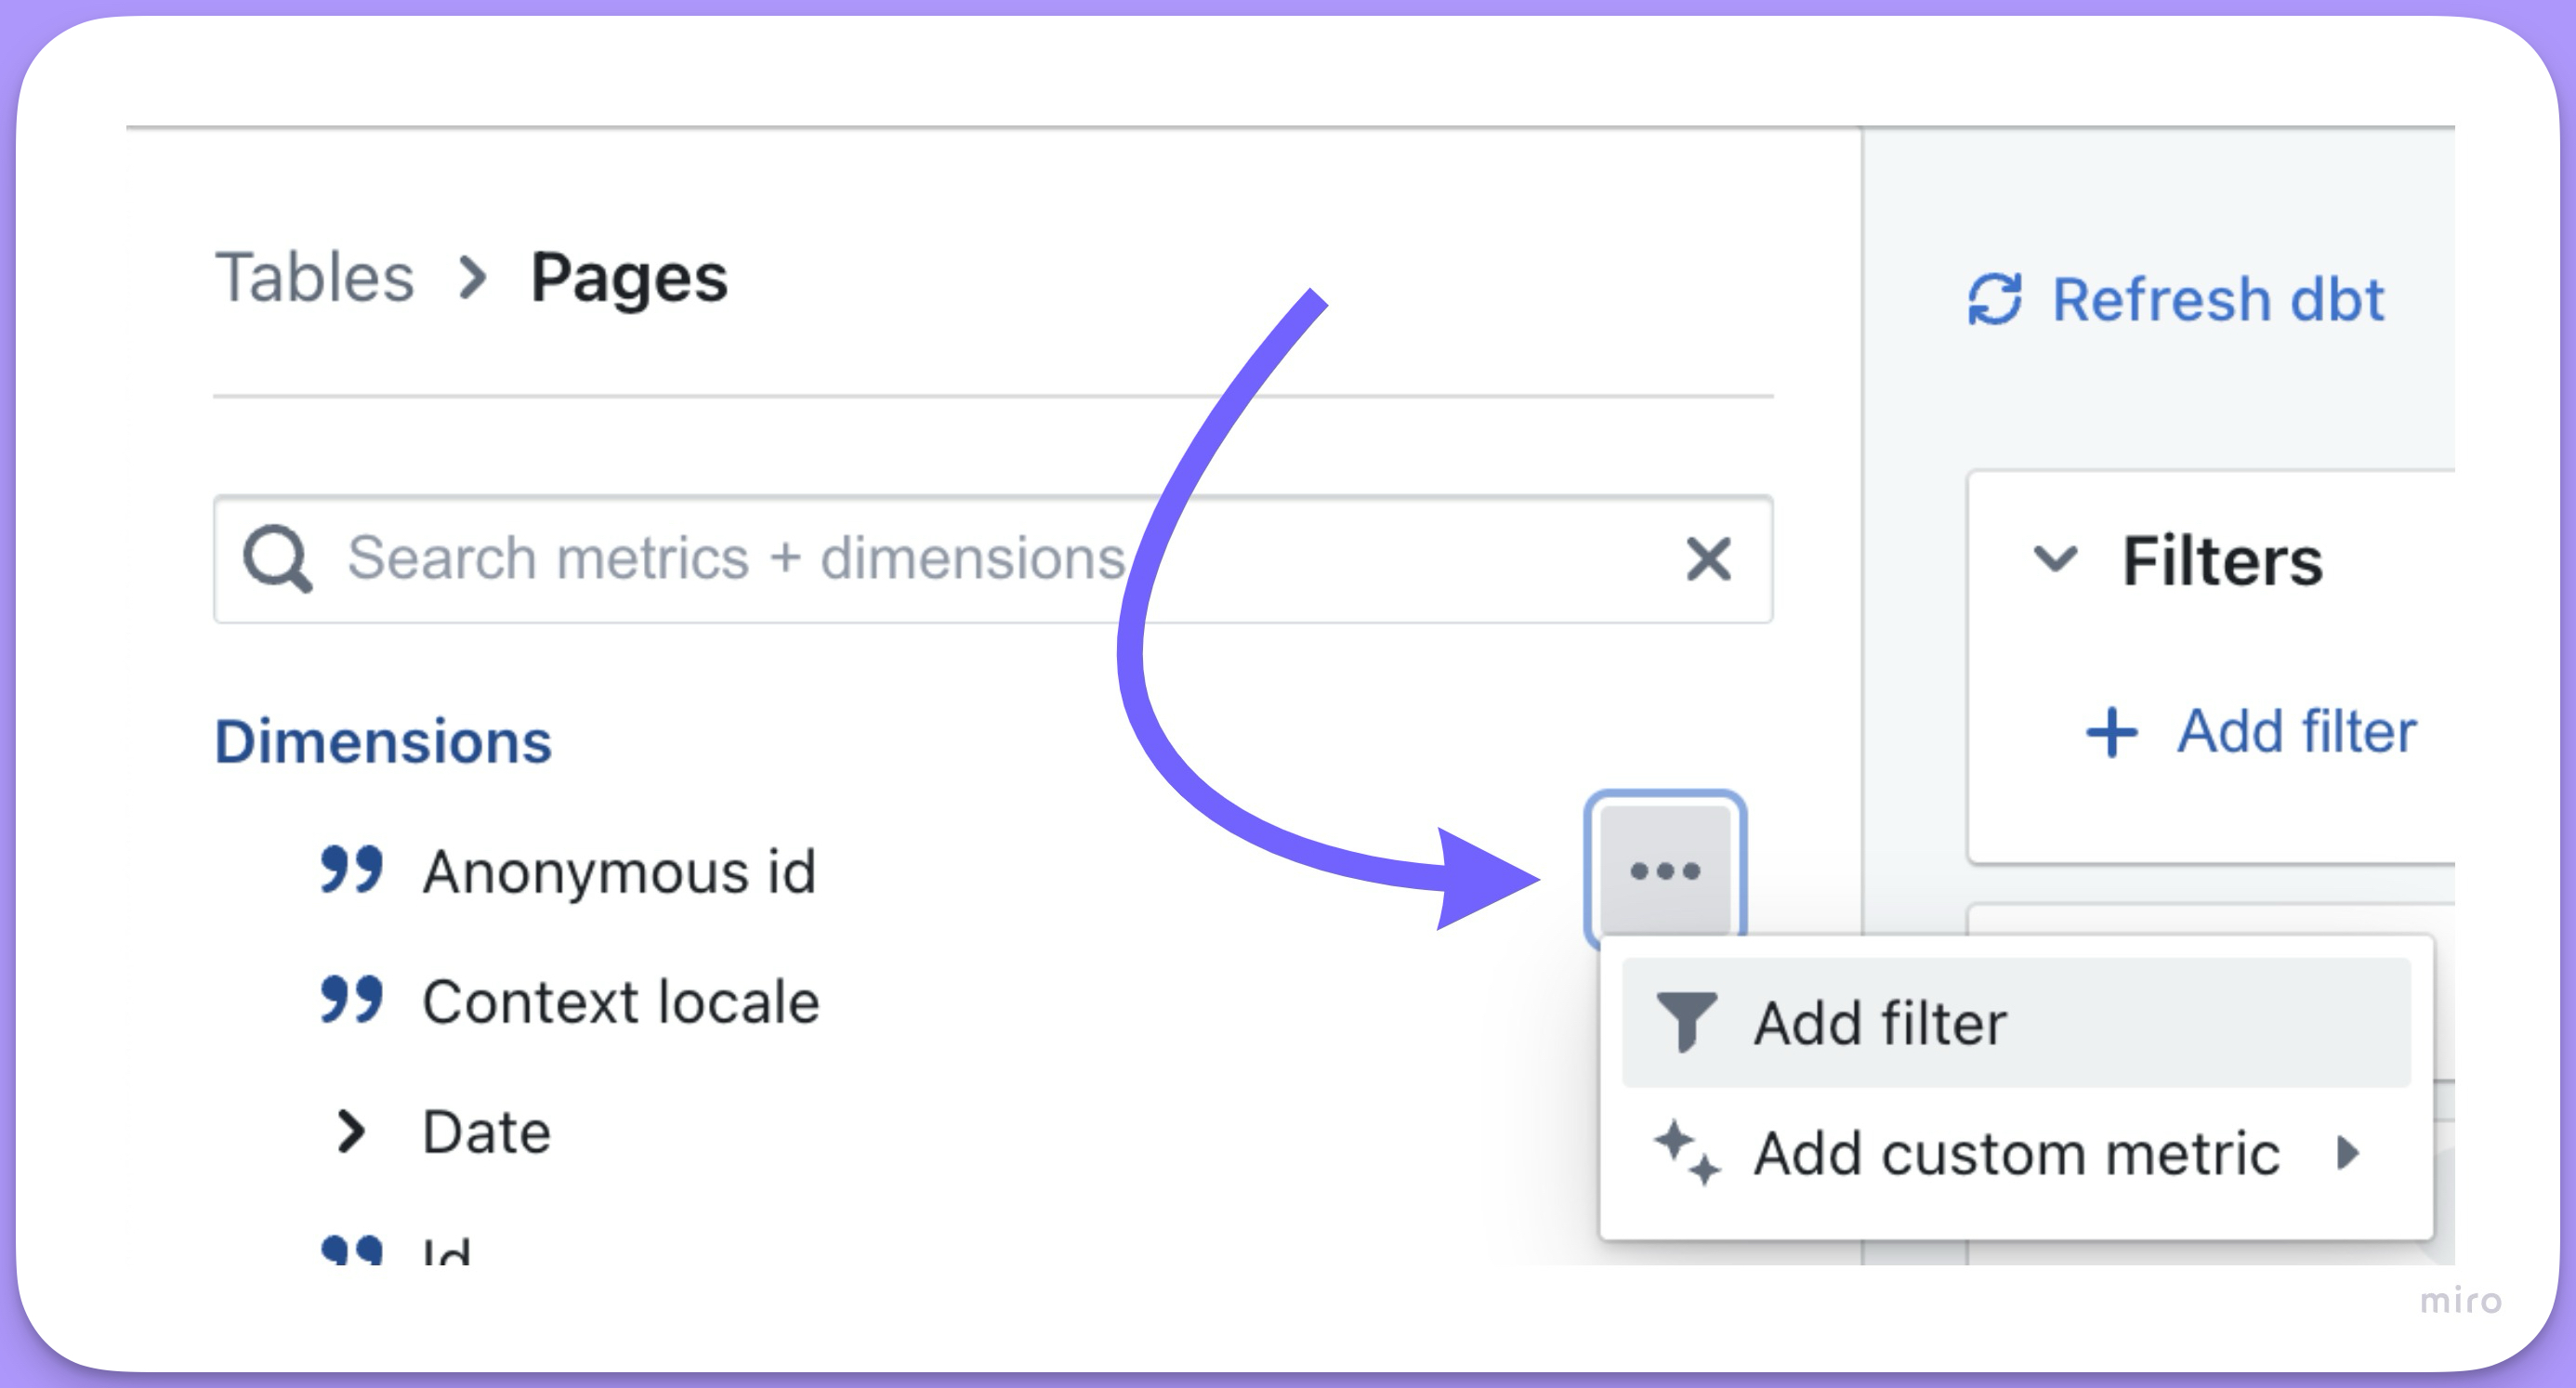
Click the options for a field in the sidebar list, then click add filter. The filter icon that appears when you hover over a dimension or metric does the same thing.
From the results table
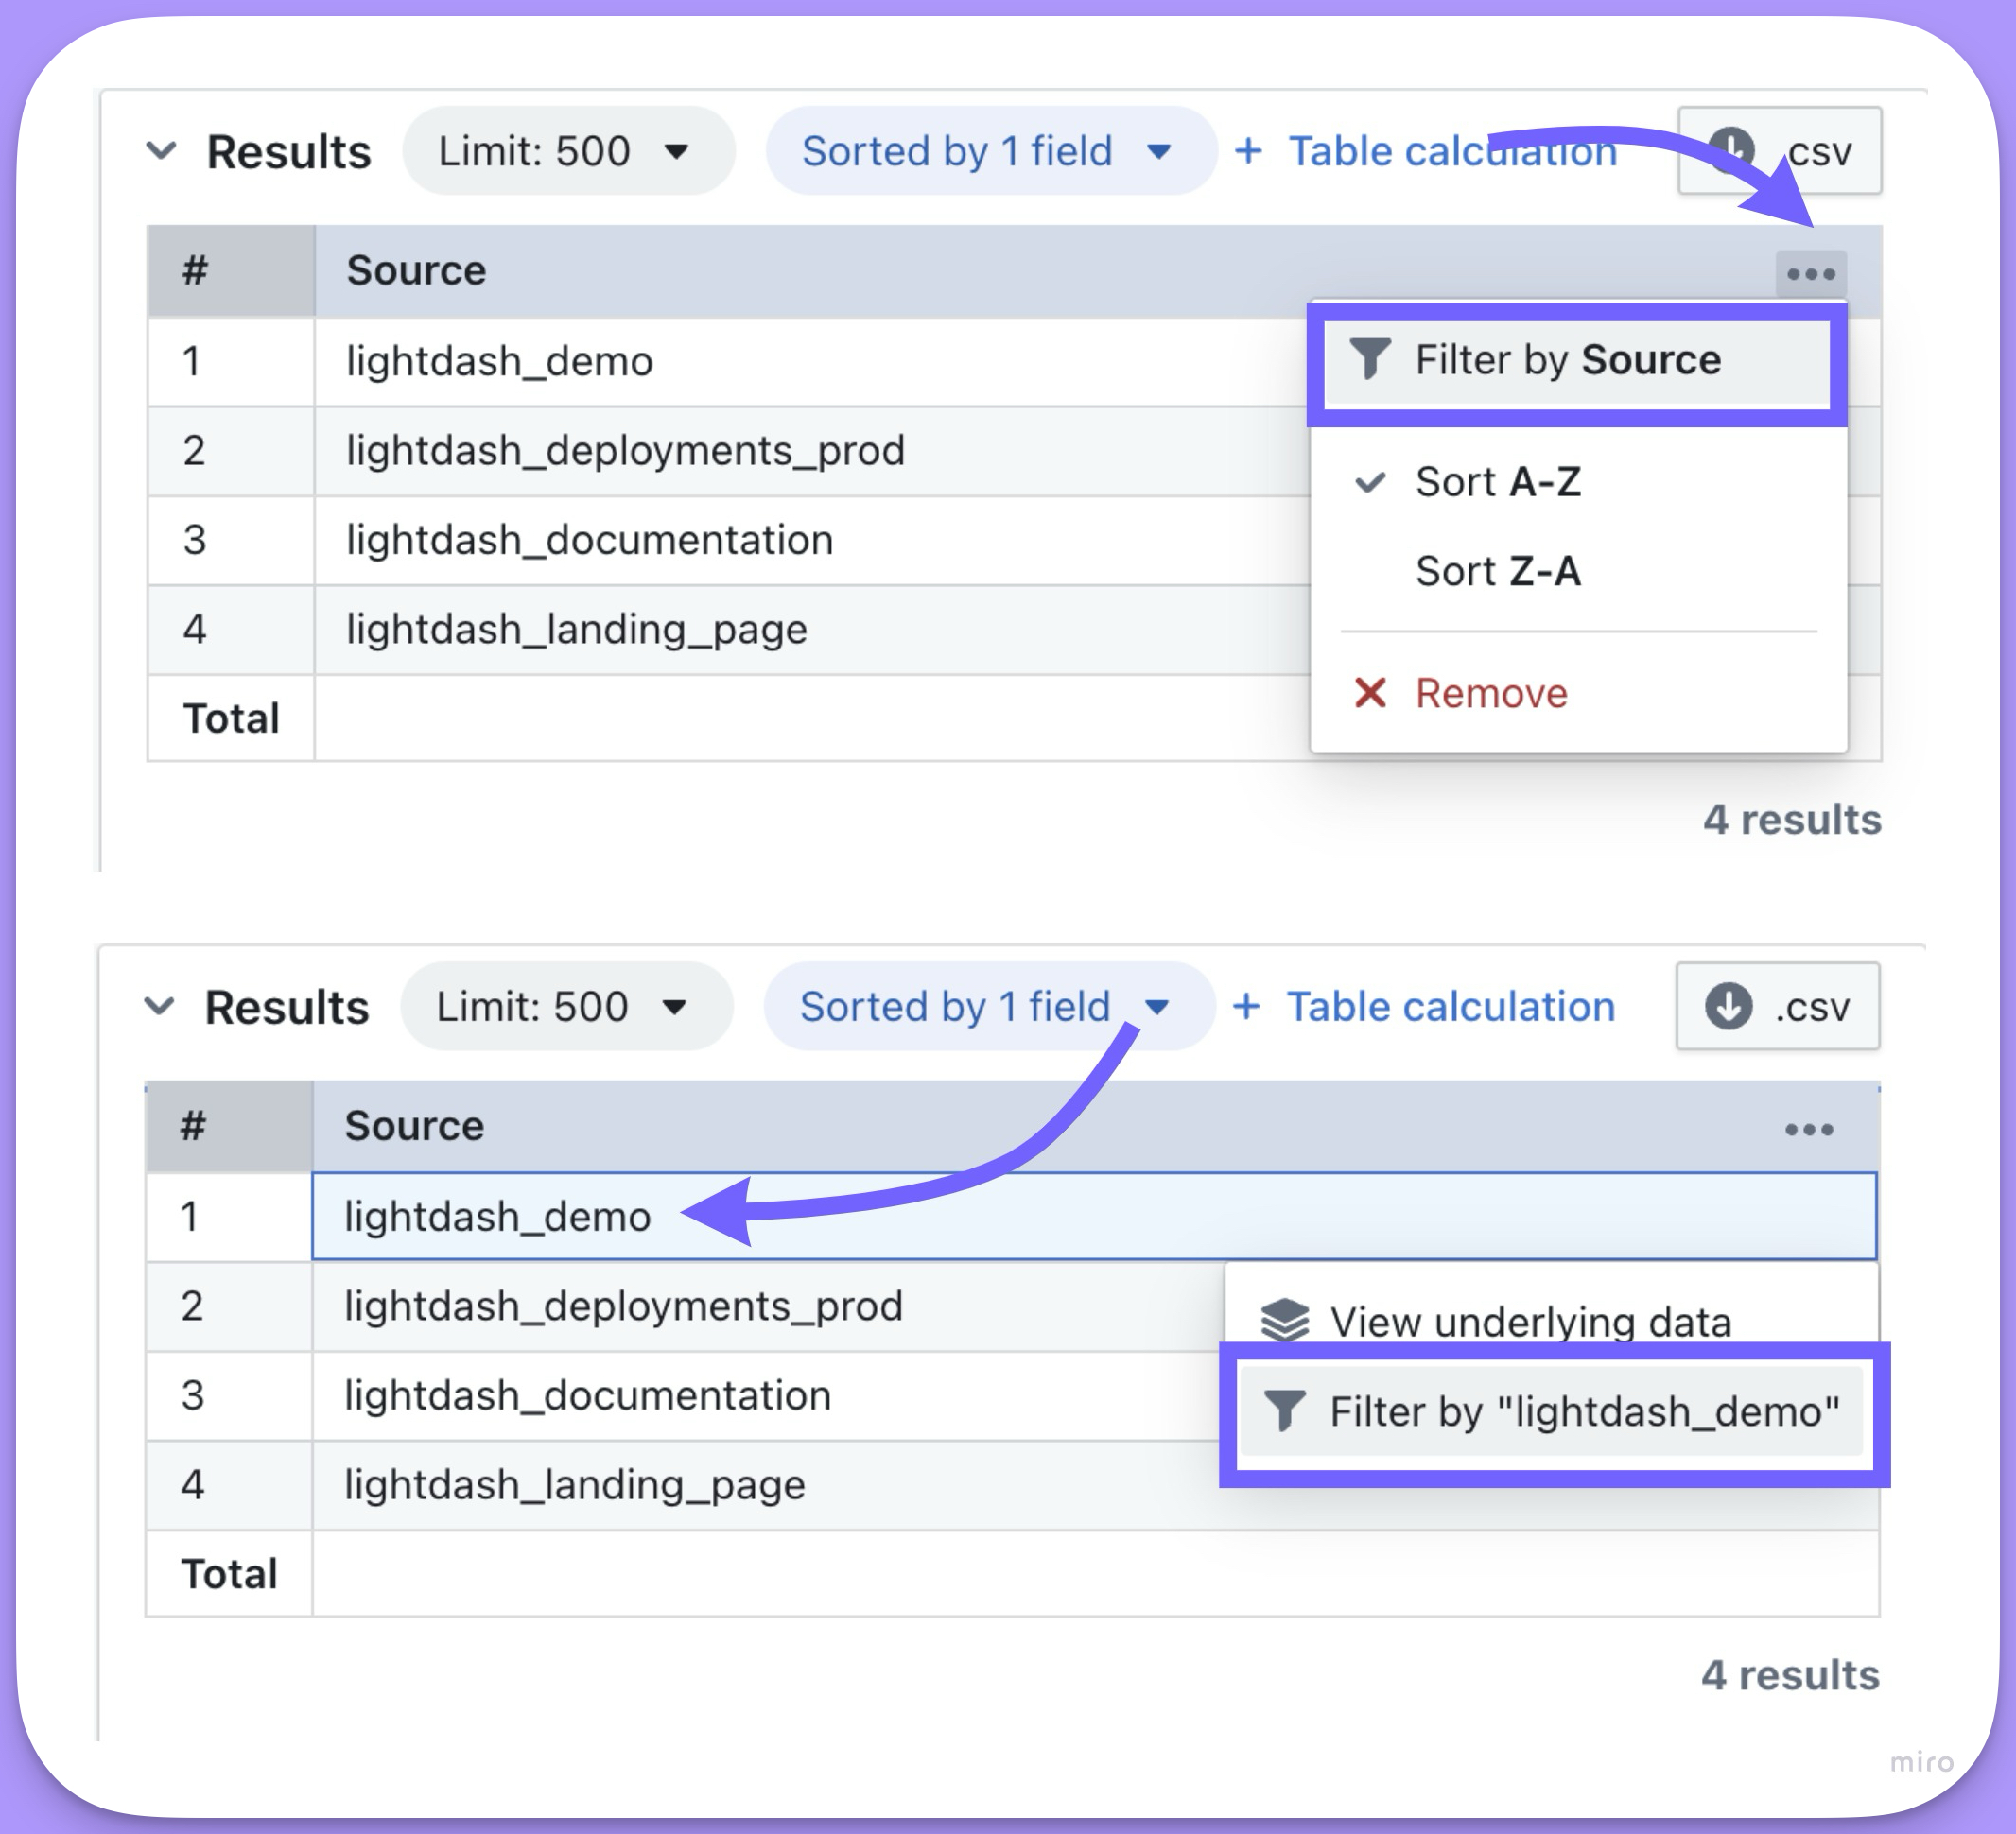
Once you have results, click the three-dot menu of the column you want to filter on and choose Filter by [field name], or click a value in the table to filter by that value.
Nested filters
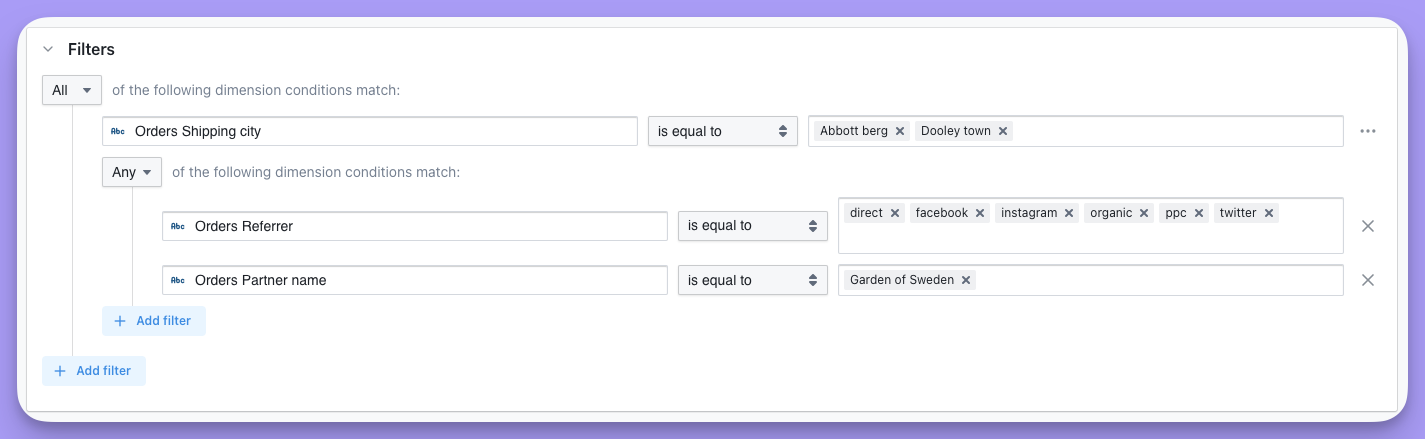
To nest filters, click the options button on the right-hand side of a filter and choose convert to group.
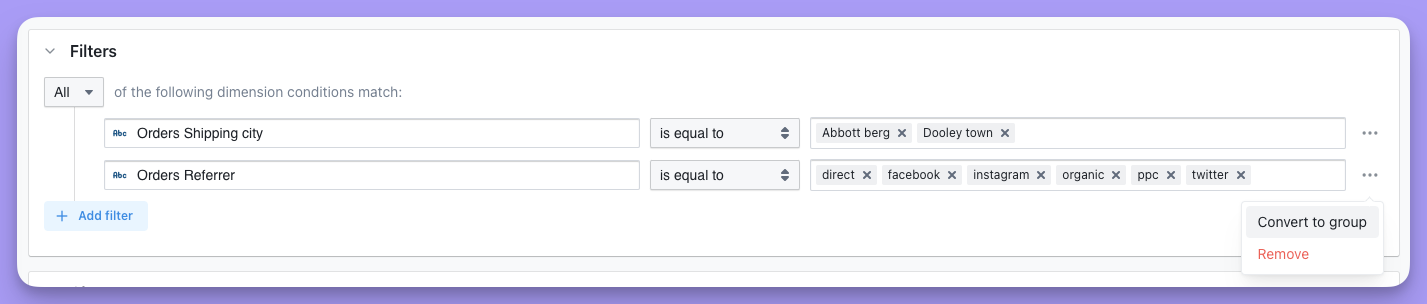
Then add a filter to the group by clicking add filter.